")

Weekly Market Commentary
February 9th, 2026
Message from the CIO
Insights from Harison Sidhu, Cambridge Chief Investment Officer
The past several weeks have delivered a meaningful uptick in market volatility, driven largely by rapid developments in artificial intelligence and shifting risk perceptions across several major asset classes. The catalyst has been the release of Claude Code, a product with the potential to disrupt a wide range of highly profitable software businesses.
While it’s difficult to determine whether the market is accurately assessing winners and losers at this stage, what is clear is that AI-driven capabilities are only getting stronger, and evaluating the strength of a company’s competitive moat has never been more important. We should note that we still feel strongly that in aggregate these technologies will create more business opportunities than they destroy and are likely to bring about significant productivity gains. This is desperately needed by the global economy and will not only help push stock prices higher but also aid countries with large debt servicing needs and even tame inflation.
These disruptive forces represent real risks for many existing business models, even as they create new opportunities for others. This dynamic has been especially challenging for public markets given the large weight of the technology and software sectors within major U.S. equity indices. As of February 5, 2026, the MSCI Software Index is down nearly 21% year-to-date, sharply underperforming the broader S&P 500.
Adding to the pressure, investors have become increasingly aware that large private market investment firms may hold significant exposure to the very software companies most at risk, whether through buyout strategies or private credit funds. In turn, publicly traded alternative asset managers have experienced notable share price declines, and allocators are increasingly focused on software exposure throughout their portfolios.
Crypto markets have not been immune either. Major cryptocurrencies have suffered brutal pullbacks, with Bitcoin losing nearly a third of its value in the first five weeks of this year alone. This downturn reinforces a trend we’ve been watching for some time: the rising correlation between digital assets and the technology sector. We hypothesize that many of the institutions and investors that actively purchase cryptocurrencies also tend to be overweight technology stocks in their portfolios. This relationship might undermine crypto’s perceived diversification benefits, particularly in chaotic environments, and contribute to deeper portfolio downturns during risk-off moments.
In our 2026 Market Outlook, we emphasized the importance of building more diversified, higher quality, and more defensive portfolios. Recent volatility underscores that message. Now more than ever, investors should consider expanding their opportunity set beyond U.S. large cap technology stocks, incorporating defensive and high-quality companies, international equities, smaller capitalization stocks, and healthy allocations to fixed income assets.
As always, we are here to help you navigate these shifts and assess what they mean for your portfolios. Please feel free to reach out with any questions or if you would like to discuss these developments in more detail or visit the Research Center to review more of our insights.
Week in Review
This week’s data offered a mix of momentum and moderation. Manufacturing activity improved, but labor indicators softened, and price pressures — especially in services — remained elevated.
Manufacturing: Growth with a Caveat
Business surveys opened the year on firmer footing. ISM Manufacturing returned to expansion at 52.6 (from 47.9), its first expansion in a year, led by New Orders (57.1), Production (55.9) and Backlog of Orders (51.6). Yet the survey also highlighted ongoing supply‑chain friction, with Supplier Deliveries (54.4) indicating slower lead times and customers’ inventories reported as “too low” (38.7), reinforcing a narrative of restocking demand. S&P Global’s Manufacturing Purchasing Managers’ Index (PMI) also signaled stronger output (the strongest since May 2022) but offered an important nuance: production outpaced new orders, contributing to further finished‑goods inventory accumulation — an imbalance that is difficult to sustain without clear demand reacceleration.
Employment: A Defensive Shift
The employment backdrop was less encouraging. ISM Manufacturing employment improved but remained in contraction at 48.1, suggesting firms are meeting higher activity with caution on headcount. ISM Services employment held just above breakeven at 50.3, indicating hiring is positive but fragile. Hard data echoed that cooling tone: December Job Openings and Labor Turnover Survey (JOLTS) openings fell to 6.5 million, and the job‑openings rate slipped to about 3.9%, reflecting softer labor demand into the year‑end. Weekly claims also weakened for a second week, with initial claims rising to 231,000 (week ending January 31) while continuing claims stayed low at 1.844 million. The Challenger report added to the caution, with 108,435 announced layoffs in January, the highest January total since 2009. In all, the labor market has been able to absorb the majority of the displaced workers; however, these figures point to a more defensive posture.
Inflation: Persistent Business Pressures
Inflation signals remain mixed. ISM price indexes stayed elevated (Services Prices at 66.6 and Manufacturing Prices at 59.0) pointing to ongoing cost pressure even as the labor market cools. Meanwhile, the University of Michigan’s preliminary February survey showed sentiment edging up to 57.3, with one‑year inflation expectations falling to 3.5% but long‑run expectations rising to 3.4%, a reminder that inflation psychology has not fully re‑anchored. If labor demand continues to cool, it could help temper inflation over time, but survey evidence suggests firms are still managing higher costs.
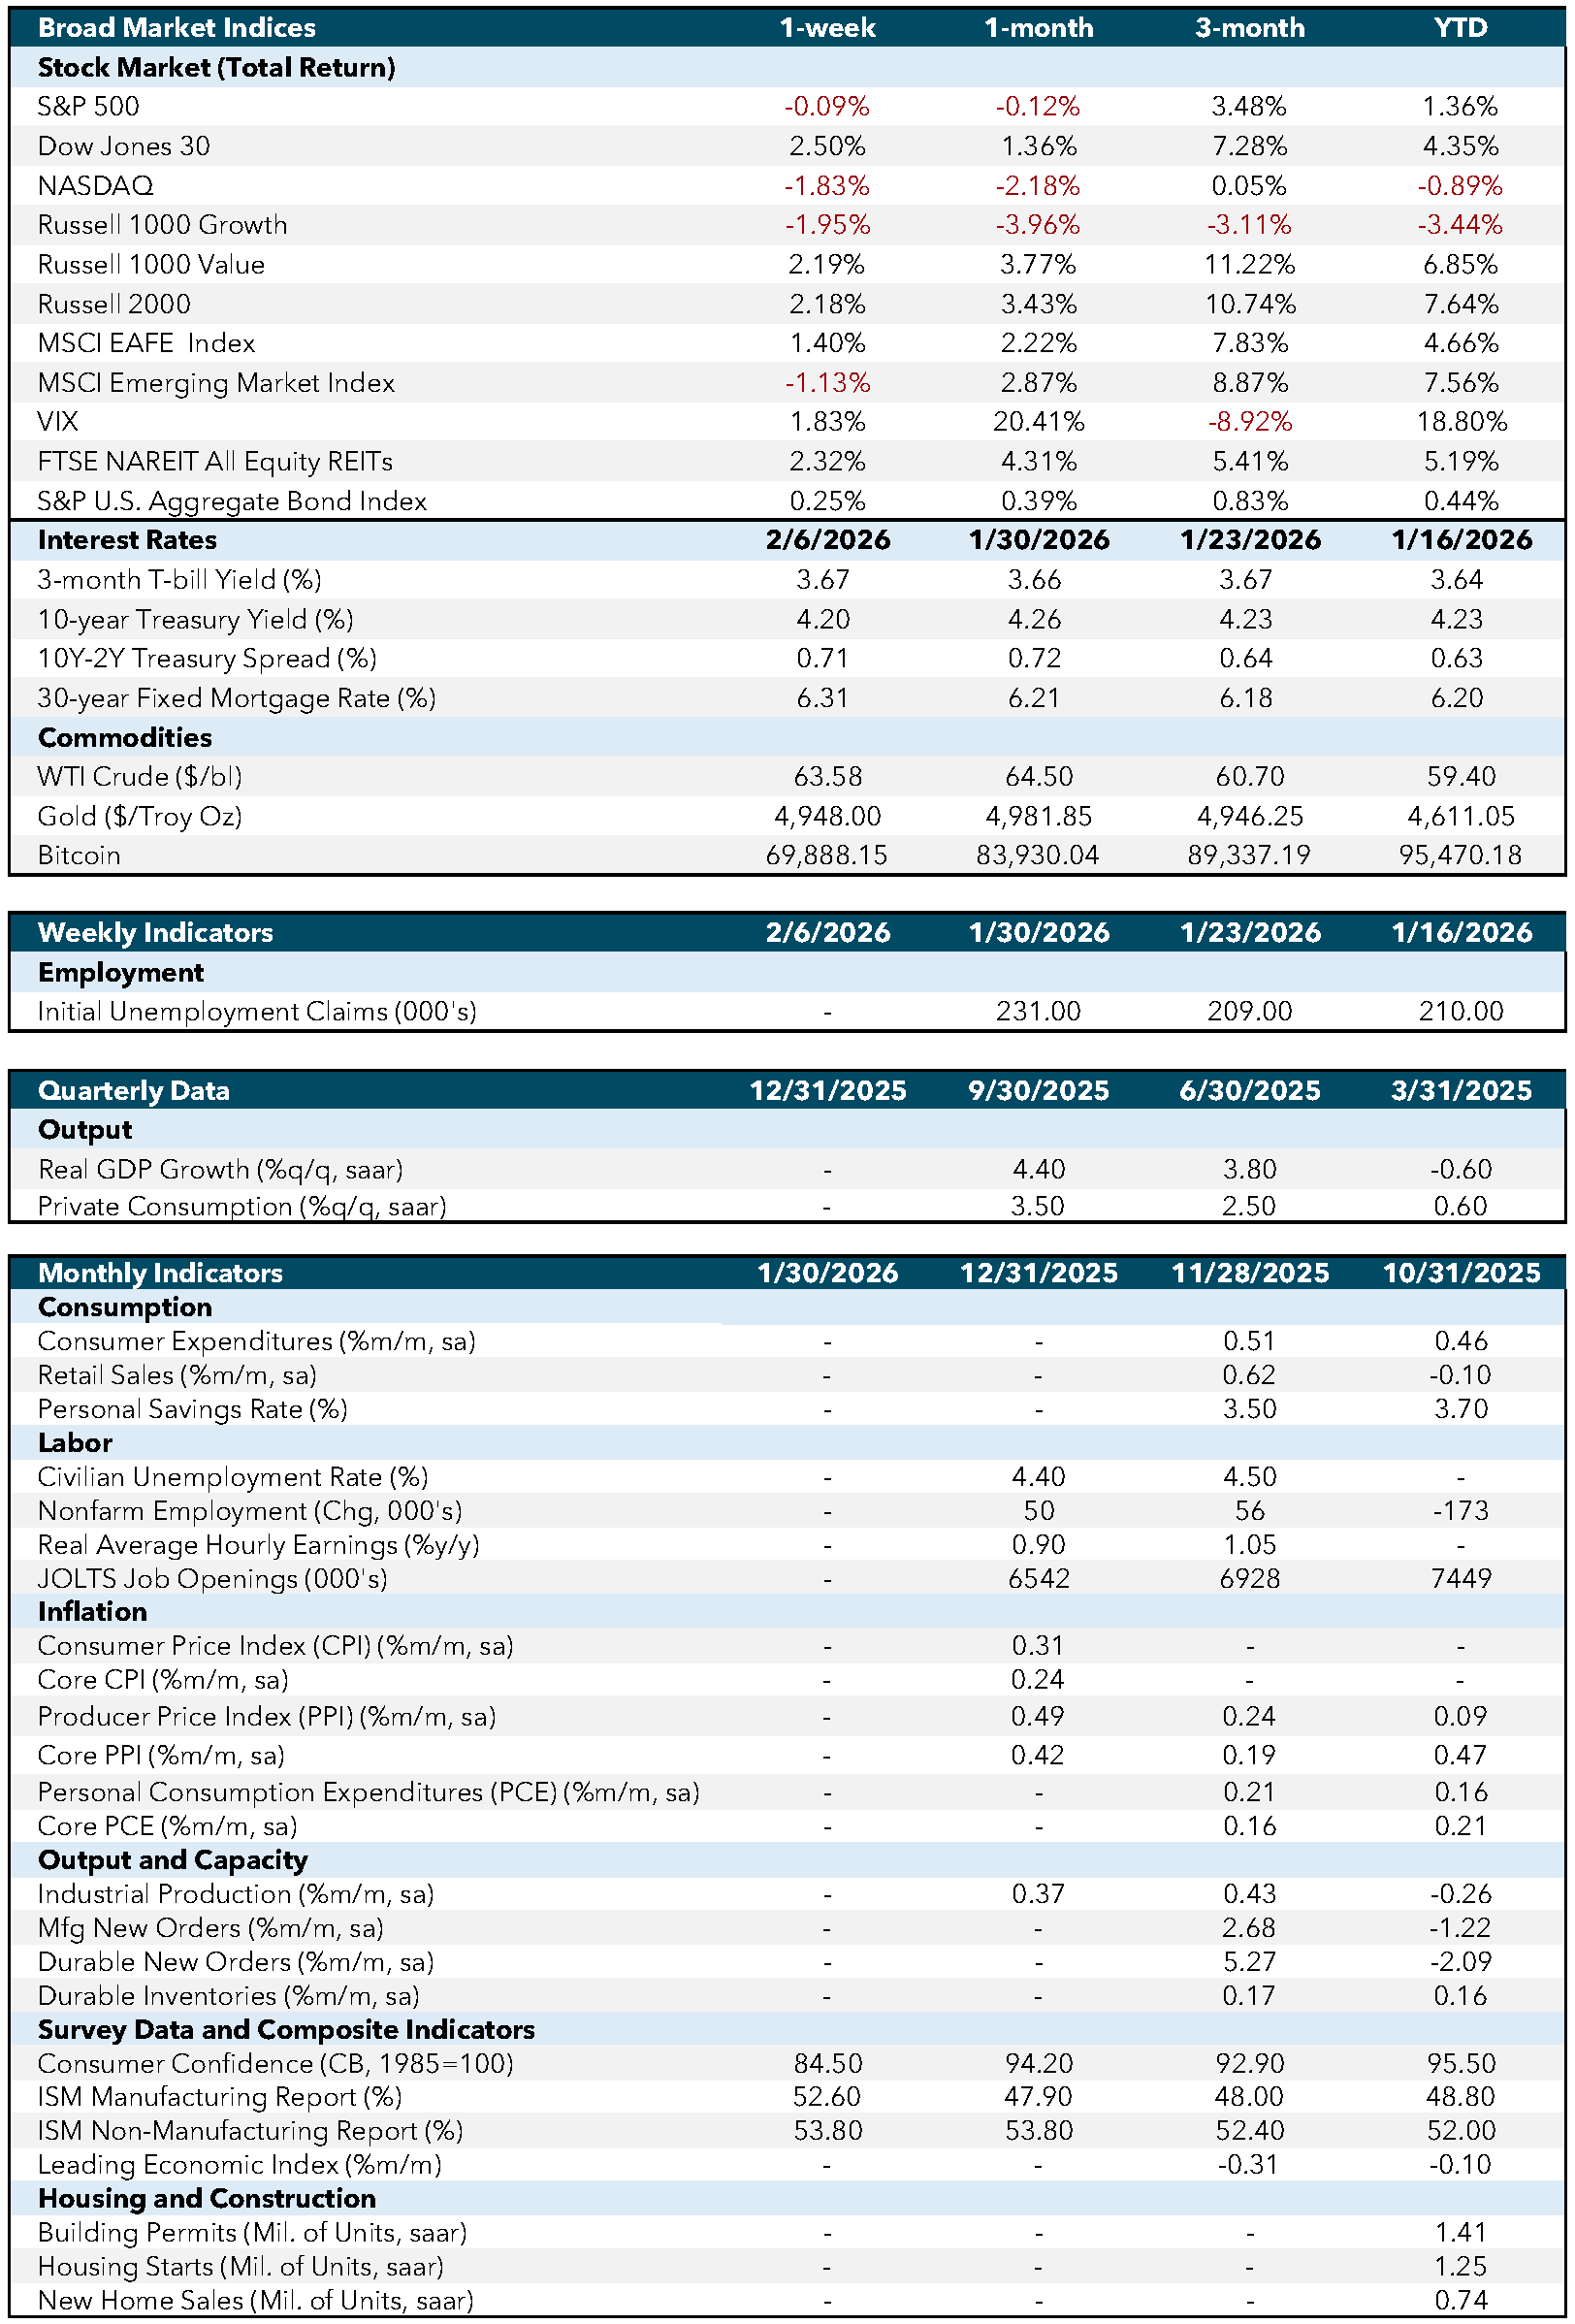
Economic and Capital Markets Dashboard
Week Ahead…

The upcoming week presents a concentrated macro schedule as markets navigate a backlog of delayed reports following the recent federal government shutdown. This compressed data cycle serves as a critical inflection point, either validating recent manufacturing momentum or confirming the “defensive shift” observed in late-January labor indicators.
Labor: Testing the Defensive Posture
After weaker signals in job openings and a rise in announced layoffs, the rescheduled January payroll report becomes a critical audit of hiring momentum. Nonfarm Payrolls, the unemployment rate, and broader underemployment (U‑6) will help determine whether the current “fragile but functioning” hiring environment is slipping into a more persistent labor market slack. A higher underemployment rate or softer participation would suggest displaced workers are taking longer to find new roles, reinforcing the defensive tone seen in recent indicators.
Consumption and Inventories: The Restocking Audit
The consumer narrative will be clarified through core retail sales, while business inventories will provide a direct follow‑through to the “restocking” theme embedded in recent manufacturing surveys. Together, these releases should help separate a true demand rebound from a production-led inventory build. Housing data later in the week adds a rates-sensitive check on big-ticket household activity and whether elevated financing costs are still constraining turnover.
Inflation: Anchoring Price Psychology
The week also brings a key intersection of price stability and rates. Treasury auctions will gauge appetite for duration ahead of the Consumer Price Index (CPI) release. With business price indexes still elevated even as labor cools, CPI will shape whether inflation expectations continue to drift lower in the near term, or whether persistent cost pressures remain a structural risk to the soft-landing narrative.
Economic Indicators:
- CPI: Consumer Price Index measures the average change in prices paid by consumers for goods and services over time. Source: Bureau of Labor Statistics.
- Core CPI: Core Consumer Price Index excludes food and energy prices to provide a clearer picture of long-term inflation trends. Source: Bureau of Labor Statistics.
- PPI: Producer Price Index measures the average change in selling prices received by domestic producers for their output. Source: Bureau of Labor Statistics.
- Core PPI: Core Producer Price Index excludes food and energy prices to provide a clearer picture of long-term inflation trends. Source: Bureau of Labor Statistics.
- PCE: Personal Consumption Expenditures measure the average change in prices paid by consumers for goods and services. Source: Bureau of Economic Analysis.
- Core PCE: Core Personal Consumption Expenditures exclude food and energy prices to provide a clearer picture of long-term inflation trends. Source: Bureau of Economic Analysis.
- Industrial Production: Measures the output of the industrial sector, including manufacturing, mining, and utilities. Source: Federal Reserve.
- Mfg New Orders: Measures the value of new orders placed with manufacturers for durable and non-durable goods. Source: Census Bureau.
- Durable New Orders: Measures the value of new orders placed with manufacturers of durable goods. Source: Census Bureau.
- Durable Inventories: Measures the value of inventories held by manufacturers for durable goods. Source: Census Bureau.
- Consumer Confidence (CB, 1985=100): Measures the degree of optimism that consumers feel about the overall state of the economy and their personal financial situation. Source: Conference Board.
- ISM Manufacturing Report: Measures the economic health of the manufacturing sector based on surveys of purchasing managers. Source: Institute for Supply Management.
- ISM Non-Manufacturing Report: Measures the economic health of the non-manufacturing sector based on surveys of purchasing managers. Source: Institute for Supply Management.
- Leading Economic Index: Measures overall economic activity and predicts future economic trends. Source: Conference Board.
- Building Permits (Mil. of Units, saar): Measures the number of new residential building permits issued. Source: Census Bureau.
- Housing Starts (Mil. of Units, saar): Measures the number of new residential construction projects that have begun. Source: Census Bureau.
- New Home Sales (Mil. of Units, saar): Measures the number of newly constructed homes sold. Source: Census Bureau.
- SA: Seasonally adjusted.
- SAAR: Seasonally adjusted annual rate.
Market Indices & Indicators:
- S&P 500: A market-capitalization-weighted index of 500 leading publicly traded companies in the U.S., widely regarded as one of the best gauges of large U.S. stocks and the stock market overall.
- Dow Jones 30: Also known as the Dow Jones Industrial Average, it tracks the share price performance of 30 large, publicly traded U.S. companies, serving as a barometer of the stock market and economy.
- NASDAQ: The world’s first electronic stock exchange, primarily listing technology giants and operating 29 markets globally.
- Russell 1000 Growth: Measures the performance of large-cap growth segment of the U.S. equity universe, including companies with higher price-to-book ratios and growth metrics.
- Russell 1000 Value: Measures the performance of large-cap value segment of the U.S. equity universe, including companies with lower price-to-book ratios and growth metrics.
- Russell 2000: A market index composed of 2,000 small-cap companies, widely used as a benchmark for small-cap mutual funds.
- Wilshire 5000: A market-capitalization-weighted index capturing the performance of all American stocks actively traded in the U.S., representing the broadest measure of the U.S. stock market.
- MSCI EAFE Index: An equity index capturing large and mid-cap representation across developed markets countries around the world, excluding the U.S. and Canada.
- MSCI Emerging Market Index: Captures large and mid-cap representation across emerging markets countries, covering approximately 85% of the free float-adjusted market capitalization in each country.
- VIX: The CBOE Volatility Index measures the market’s expectations for volatility over the coming 30 days, often referred to as the “fear gauge.”
- FTSE NAREIT All Equity REITs: Measures the performance of all publicly traded equity real estate investment trusts (REITs) listed in the U.S., excluding mortgage REITs.
- S&P U.S. Aggregate Bond Index: Represents the performance of the U.S. investment-grade bond market, including government, corporate, mortgage-backed, and asset-backed securities.
- 3-Month T-bill Yield (%): The yield on U.S. Treasury bills with a maturity of three months, reflecting short-term interest rates.
- 10-Year Treasury Yield (%): The yield on U.S. Treasury bonds with a maturity of ten years, reflecting long-term interest rates.
- 10Y-2Y Treasury Spread (%): The difference between the yields on 10-year and 2-year U.S. Treasury bonds, often used as an indicator of economic expectations.
- WTI Crude ($/bl): The price per barrel of West Texas Intermediate crude oil, a benchmark for U.S. oil prices.
- Gold ($/Troy Oz): The price per troy ounce of gold, a standard measure for gold prices.
- Bitcoin: A decentralized digital currency without a central bank or single administrator, which can be sent from user to user on the peer-to-peer bitcoin network.
This content was developed by Cambridge from sources believed to be reliable. This content is provided for informational purposes only and should not be construed or acted upon as individualized investment advice. It should not be considered a recommendation or solicitation. Information is subject to change. Any forward-looking statements are based on assumptions, may not materialize, and are subject to revision without notice. The information in this material is not intended as tax or legal advice.
Investing involves risk. Depending on the different types of investments there may be varying degrees of risk. Socially responsible investing does not guarantee any amount of success. Clients and prospective clients should be prepared to bear investment loss including loss of original principal. Indices mentioned are unmanaged and cannot be invested into directly. Past performance is not a guarantee of future results.
The Dow Jones Industrial Average (DJIA) is a price-weighted index composed of 30 widely traded blue-chip U.S. common stocks. The S&P 500 is a market-cap weighted index composed of the common stocks of 500 leading companies in leading industries of the U.S. economy. The NASDAQ Composite Index is a market-value weighted index of all common stocks listed on the NASDAQ stock exchange.
Securities offered through Cambridge Investment Research, Inc., a broker-dealer, member FINRA/SIPC, and investment advisory services offered through Cambridge Investment Research Advisors, Inc., a Registered Investment Adviser. Both are wholly-owned subsidiaries of Cambridge Investment Group, Inc. V.CIR.0226-0513